
What are vector graphics? And what formats are there?
Table of contents
The elementary difference between vector and pixel formats
Pixel-based graphics are created using a raster, so they are also called raster graphics. Here, the larger the grid, the more pixels, the larger the file. If a raster graphic shows a circle, it will always get edges if you zoom in far enough into the image, after all, no place in the file defines what a circle is. With pixels, therefore, a circle can only be mapped approximately.
Vector graphics, on the other hand, actually store mathematically representable content – because that’s all vectors do in this context – they serve as a tool to describe the shape and position of geometric objects. A circle is defined in a vector graphic the way we know it from school: via center and radius. In addition, in a vector graphic you can specify, for example, what color the circle line should have, how thick or thin the line should be in relation to the radius, and so on.
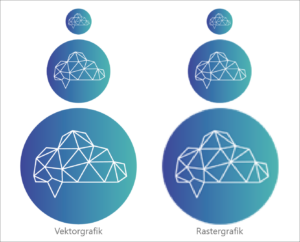
Attention: Absolute sizes do not matter for vector graphics, all image elements are described relative to each other. Therefore, vector graphics can also be scaled without loss. A vector graphic showing a circle can be zoomed into arbitrarily without showing edges at any point (apart from the pixel grid of the monitor).

Comparison of vector graphics and raster graphics. Vector graphics can be enlarged without loss of quality.
In addition to scalability, vector graphics have the advantage of requiring relatively little memory. After all, it is much more efficient to describe geometric objects mathematically than to define the color value of each pixel individually.
Limited range of validity
At this point, however, it already becomes clear how limited the scope for vector graphics is. Objects can of course only be described with vectors if they are shaped accordingly. Structures that are composed of paths (start point, end point) or so-called graphic primitives (lines, circles, polygons, etc.) can be excellently converted into mathematical language. This is not true for the disordered structures that make up photographs, paintings, or hand drawings. These cannot be captured by formulas, but only by small-scale processing of all pixels.
At this point, it is worth mentioning that the term vector graphics refers to two-dimensional content rather than spatial modeling.
Now that we know what vector graphics are all about, in the following section we would like to briefly introduce you to the most important formats.
The 6 most important formats for vector graphics
1. AI – Adobe Illustrator Artwork
AI stands for the proprietary format of the vector-based graphics and drawing program Adobe Illustrator. It supports multiple levels and transparency. AI files can also be viewed and edited in a limited way with other programs (e.g. Adobe Acrobat). However, the full range of functions is provided only in Illustrator.
2. CDR – CorelDraw File Format
CDR stands for the proprietary format of the vector-based graphics program CorelDraw. CDR files can also be viewed with other programs and converted from there to other formats (e.g. with IrfanView). However, the source data can only be edited in CorelDraw.
3. SVG – Scalable Vector Graphics
The SVG format is a standardized format for two-dimensional vector graphics and was developed in particular for the responsive rendering of graphics on websites. Technically, the format is based on the XML markup language. SVG files can be opened and viewed in any browser. However, to edit an SVG file you need programs like Adobe Illustrator or CorelDraw.
4. WMF – Windows Metafile
The WMF format is a vector-based graphics format from Microsoft that can also include raster graphics if necessary. It was developed as a native vector format for Microsoft’s Office applications Word, PowerPoint and Publisher and enables the exchange of graphics across different programs, e.g. via the Windows clipboard. Windows Enhanced Metafile (EMF) is a further development of WMF that supports higher color depths, among other things.
5. EPS – Encapsulated PostScript File
EPS stands for Encapsulated Postscript. The format is based – as the name suggests – on the PostScript page description language, which was designed specifically for electronic publishing and printing of documents. The EPS format, like the well-known Portable Document Format (PDF), was developed by Adobe and is considered its predecessor.
6. PDF – Portable Document Format
You know the PDF format*, of course. In a way, it has to be in brackets because, unlike the formats mentioned above, it can also store raster graphics. In fact, PDF documents are usually in mixed form: While fonts are almost always saved vectorized, digital photos can of course only be embedded in the document as raster graphics.
Tip: Read here how to save image-only files as PDF.
Extract texts from PDF files: with our online tool.
* Since the F in PDF stands for format, it should actually be PD format. However, this logic did not prevail in plain language.
What are vector graphics used for?
Two-dimensional vector graphics can be used for very different purposes. You will most often encounter vector graphics in logos and lettering. Other use cases include:
-
- Infographics
- technical diagrams
- artistic illustrations
- Maps and city plans
- Fonts
- Comics
Which programs can be used to edit vector graphics?
Of course, it all depends on what kind of vector graphics file it is. Proprietary file formats such as AI or CDR should ideally be edited with the application originally intended for them, i.e. AI files with Adobe Illustrator and CDR files with CorelDraw. However, this does not mean that it is not possible to edit these formats with alternative programs as well. With the free software Inkscape, for example, all of the above formats can be opened and edited.
Below we list the most important vector graphics programs for you. In parentheses are the operating systems for which the respective program is intended.
-
- Adobe Illustrator (Windows, macOS)
- Affinity Designer (Windows, macOS)
- Apache OpenOffice Draw (Windows, macOS, Linux)
- CorelDraw (Windows, macOS)
- FreeHand (Windows, macOS)
- Inkscape (Windows, macOS, Linux)
- Carbon (Linux)
- PhotoLine (Windows, macOS)
- LibreOffice Draw (Windows, macOS, Linux)
- Synfig (Windows, macOS, Linux)
- Xara Designer Pro (Windows)
- Xfig (Linux)
How to create a vector graphic?
There are two ways to create a vector graphic.
Option 1: From scratch. In this case, the graphic is drawn exclusively with the means of the vector graphics program.
Option 2: By vectorizing an already existing raster graphic. This can be a scanned preliminary drawing, for example. By tracing the lines in the vector graphics program, the graphic is vectorized. For many programs, this is now possible without manual intervention. The only things that need to be set are:
-
- the level of detail of vectorization
- the color depth of the target format
- the transparency of the background
Test the image management of teamnext
teamnext’s Media Hub is a cloud-based solution for marketing and PR teams of all sizes. All vector formats mentioned here are supported by the system and can be converted into pixel-based formats with any resolution, depending on the intended use. In addition to practical tools for file conversion, numerous metadata tools are also provided, e.g. batch processing (mass tagging and renaming), rights management or AI-based recognition of persons and objects.
If we have made you curious and you simply want to try out the possibilities of a professional image management software, then you can get started immediately with a free 14-day test phase for the teamnext | Media Hub. In addition, you can book an appointment for a free online product demo with one of our experts at any time. Simply use our contact form for this purpose.


